


Today we present you with a brand new index which provides a few insights into the mind of the people. As you know our theory of political evolution (Political Systems Lifecycle, The Law of Political Systems Direction and The Three Laws of Political System Change) indicates that each person needs to convince themselves that a given political system is obsolete before moving to the next one. As such every group on earth stands on a different phase of their political evolution. There is no such thing as an homogeneous evolution. People only evolve when they are ready and not before.
This index was developed during our search of some statistical information that would indicate where do people stand in terms of their political evolution towards Libertarianism. The ideal index would take into consideration mountains of data and piles of psychological and political parameters alas, we don't have neither the time nor the resources to do so. Consequently, we had to utilize whatever data may be available to us and as such we settled on a very simple statistic. We have mentioned several times that people have become disillusioned with democracy and this is showing in the percentage of people who choose not to vote. The voluntary and active choice not to vote represents in ultimate analysis a rejection of the democratic system and can thus be used to approximate the stage of peoples' political evolution. Luckily enough this data is readily available from several public sources.
The meaning of the LIBEX index
The LIBEX meaning is easy to interpret. A 100% simply means that all the people registered to vote anywhere in the world actually voted. A 0% means the opposite, this is, that of all registered voters anywhere in the world not one of them voted. Simple, right?
In a theoretical democracy the LIBEX Index should have a value of 100%. In a theoretical Libertarian system (or lack of system to be precise) the value should be 0% simply because there would be no countries. And so the closer we are to 100% the more oppressed we are. The closer we are to 0% the freer we are.
LIBEX for Parliamentary Elections
We will first investigate the value of the LIBEX index for Parliamentary Elections. If we plot the full index we obtain:

We also added a linear regression line (black) whose equation can also be seen in the chart. A few obvious conclusions immediately jump out. The first one is that since 1950's voter turnout has been decreasing steadily and this decrease is not a one time event nor do "special circumstances" apply. Since 1950's people have been getting steadily fed-up of governments. This is indeed a very good sign of political evolution. People giving-up believing in a political system is one of the pre-requisites for political evolution. We can actually place a number to this disillusionment thanks to our calculation. We can see that every year about 0.28% of all registered voters gives up and although this number seems small, consider that over the last 60 years about 20% of all potential voters anywhere in the world have said NO!
The second observation is that there seems to be a clear break in the tendency in or about 1970's. In order to further investigate, we have split the data and re-plotted. The results can be seen in the plots below:
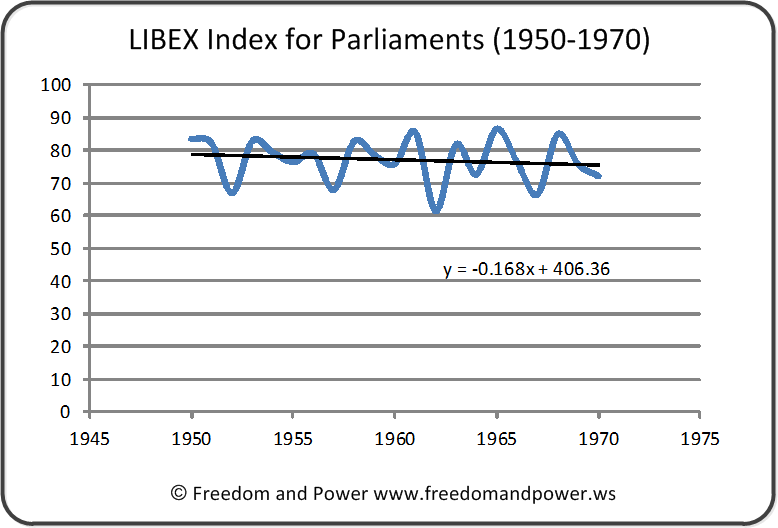
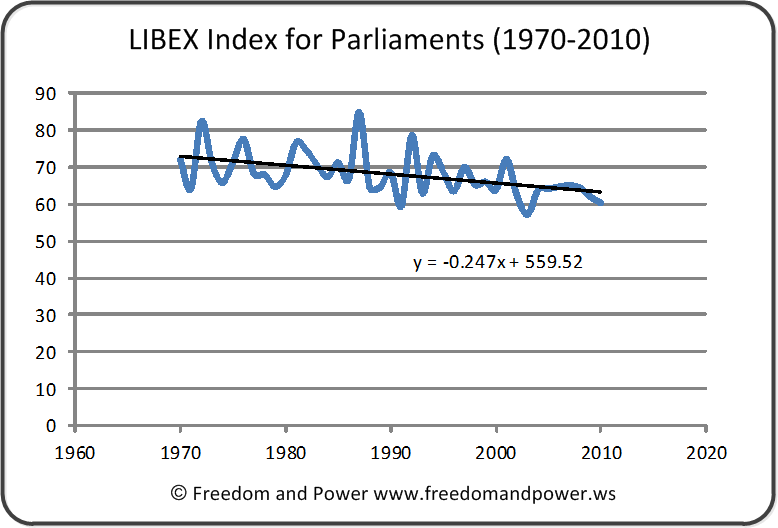
As you can see, between 1950 and 1970 fewer people were becoming disenchanted with democracy; only about 0.17% per year. However, between 1970 and 2010 this number jumped to 0.24%. What happened? Well, if you bother going back in time and looking at the economic history of the world, you will notice that the two decades between 1950 and 1970 were actually quite stable and quiet. Yes, there were problems throughout the world but those problems were not generalized. However, all this changed since the 70's. The seventies ushered the advent of unlimited spending and printing by governments. In turn this triggered massive economic and financial earthquakes the likes of which were never seen before. Massive economic problems are the keys to political evolution (according to our theory) and therefore people began to evolve.
As with any evolutionary process, political evolution is slow and transitional in nature. We would have been extremely surprised if the LIBEX Index would have collapsed catastrophically.
LIBEX for Presidential Elections
As we were browsing through the raw data, we noticed that it seemed more disperse and incoherent than it should have been. Because of this reason we decided to separate Parliamentary from Presidential elections. It would seem that there are notable differences between both. Take a look at the graph below:
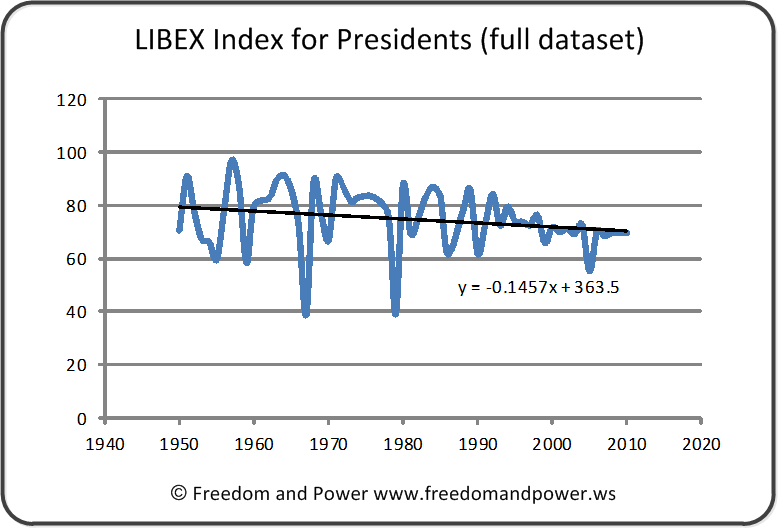
The first interesting information is that the data is much "noisier" up to and including roughly 1995. Beyond this point the data seems to have quieted down. Also, the change that occurred in or around 1970 in the Parliamentary version is not clear any longer. Lastly, we can see that the rate of decrease in voter turnout is roughly half of the same rate for the Parliamentary version.
LIBEX Commentary
The conclusions that can be drawn are quite interesting. It would seem that people become disillusioned far faster with the nameless and faceless mass that all Parliaments have, but not so much with a single person embodied in the Presidential figure. People distrusts Parliaments twice as much as they do Presidents. Because of this fact it is quite clear that as Presidential elections depend upon a few candidates that can be gotten to know better this also makes peoples' decisions quite more variable. There is some statistical stability in 100 or 200 parliamentaries, but there is very little statistical stability when the same race includes 2 or 3 viable candidates at most. In the latter the number of choices drops drastically thus people choose not to vote far more frequently. Yet, it is clear that passing 1995 this "noise" characteristic decreased substantially. It would seem that past this year people choose to believe in the need for Presidents far more than before. We believe that this phenomenon is nothing but the very human need to believe in something or somebody in times of need. Although economic debacles have been occurring since the 70's there was a significant change in generations between 70's and the 90's. The new generation has never known economic stability and are thus far more desperate for a "fix". As such they choose to vote for Presidents far more consistently than the previous generation. They continue to distrust Parliaments, but they believe in "a" person, "a" leader who can bring order and progress. Silly them.
LIBEX Calculation Methodology
For those interested, the calculation of the LIBEX Index is quite straightforward. First data for worldwide elections are separated in two groups: Parliamentary and Presidential. This is so because the behaviour of people in each type is different. Once this is done the number of voters and the number of registered voters in each group are added for every year. Then a percentage of voters to registered voters is calculated (voter turnout percentage). Thus, the LIBEX Index represents a percentage of world-wide registered voters who actually vote.
