


 This project was developed as a spin-off from lesson #207 (Solving Country Defaults Through Printing). In this lesson we discovered that there is a correlation between:
Real GDP = GDP - Debt
%Default = Defaulted Debt / Real GDP * 100
When the Real GDP raises the defaulted amount drops. The opposite is also true.
However, in the lesson we used consolidated numbers from the entire world. We were curious to find out what would happen if we would to perform this very same calculation for every country on earth, for as many years as possible. Would this provide a better view of which countries are at risk and by how much?
The first task was to estimate what is the %Default boundary. This is, at which point do countries begin to default. From the original world-consolidated numbers we found out that when %Default reaches about 1580% with a standard deviation of 872, countries tend to default.
Of course, this boundary of 1580% +/- 872% is not written in stone, it is simply the statistical average around where defaults tend to oscillate. This number is quite significant since if true (it may well not be), this means that the amount of debt that countries can take on without significant risk of defaulting is quite large and it is also dependent upon their productive capacity.
However, what matters is not how much a country produces, but how much it actually has on an ongoing basis, what determines the chances of default. In a sense the calculation makes sense but in a different one it does not.
We are subtracting GDP (which is the yearly productive capacity) from the total debt. This is not exactly total country assets minus debts. It is yearly production minus total debt. So it is a strange Net Assets calculation, if we can call it that. But, on the other hand, governments extract wealth from the GDP and their capacity to borrow is also GDP-related. In this sense, the GDP does provide an estimate of the government-wealth.
This process makes the scale dynamic; there is no pre-set amount of debt (in terms of money) that a country can take without going bankrupt. It all depends of the GDP.
In the end, however, we don't know why it works; all we know is that it seems to work.
What we also know is that this method is a very gross approximation at best. Not only the numbers are government-generated (which is bad), but the calculation of those numbers is at least suspect and carrying significant limitations and errors that are overlooked. However, these are the only numbers we have.
In the table below, we calculated:
%Default = Current Debt (GDP - Current Debt) *100
Because we can't see the future and don't know the amount of debt that will go into default once this happens. Still, it is quite illuminating.
For this calculation we used data from the International Monetary Fund, so if you see some quirky numbers, don't blame us.
We processed this data as explained above, but just as a matter of curiosity we extended the calculation using IMF forecasts. These forecasts are essentially worthless, of course, but are indicative of the IMF way of thinking: most of the time, everything works out under the best case scenario. No crashes, no issues, no hiccups. OK… It would be funny, would it not be because of the fact that the IMF actually uses these forecasts to create and impose policies to countries riddled with debt. And so, the next time you see a country go up in flames after an IMF mission, you will know the reason.
The following picture provides the color codes to understand the table.
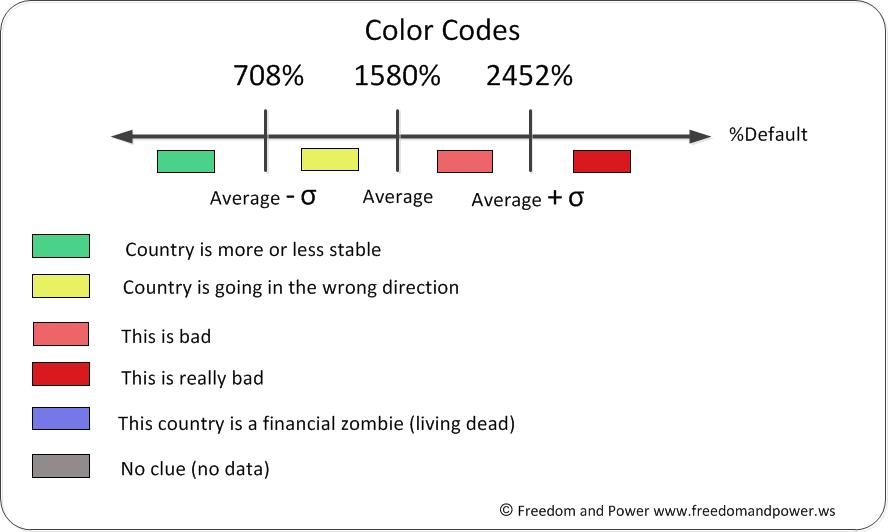
Note: countries in blue (or Zombie-Countries) are so denominated because our calculation yields a negative number. This means that their debt is far larger than their GDP. They are the living dead.
This is the table of countries. The first column contains the name of the country, the first row contains the year and the last column includes the first year the IMF estimated data. Lastly, the columns for 2013 and 2014 have double-lined walls for easy recognition.
Take a look at yours.
Also, if you want the entire table, including all the years for which the IMF had data, please download the attached Excel file.
Have fun with the data!
| [ ] | 63 kB | |
| [ ] | 51 kB |
